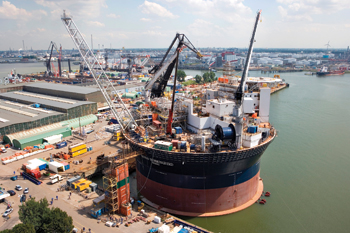


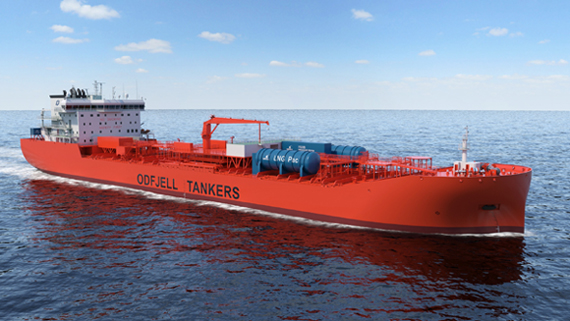

 FPSOs ... the biggest market by type
OVER $130 billion is expected to be spent on floating production units worldwide in the next five years, as per a new estimate.
In its 2014-2018 Floating Production Systems Outlook Report, Energy Maritime Associates (EMA), analysed the activity in 2013, recent industry trends and conducted a sentiment survey in order to develop a detailed forecast for each type of floating production system: Floating, production, storage and offloading (FPSO), floating liquified natural gas (FLNG), floating storage and regasification unit (FSRU), tension leg platform (TLP), Spar, Semi, and floating, storage and offloading (FSO).
According to the report, during 2013, 27 contracts were awarded, worth over $20 billion which included 12 FPSOs, 5 mobile offshore production unit (MOPUs). 4 FSOs, 3 FSRUs, 2 TLPs, and 1 Production Barge. FPSO orders have been fairly steady at 12 to 14 units for the past three years. However, this is below the long term average of 15 per year. There were no orders for FLNGs, Spars, or Production Semis in 2013.
Of these, 28 units were delivered which included 14 FPSOs, 4 FSOs, 3 MOPUs, 3 Semis, 2 TLPs, and 2 FSRUs, with 11 of these units for Brazil. While 17 units were decommissioned – 10 FPSOs, 4 FSOs, and 3 Production Semis; two of these units, both FSOs, were immediately scrapped, while the other 15 units are available for sale or redeployment.
WHAT DOES THE FUTURE HOLD?
Up to 199 orders: Between 128 -199 floating production systems are expected over the next five years with a total capital cost between $105.9 and $158.3 billion. Most likely forecast, as per the report, is 157 orders costing $129.8 billion. FPSOs account for almost half of the expected orders and 65 per cent of the capital expenditure. 15 per cent of capex will go to FLNG units, 7 per cent to Production Semis, and the remainder evenly spread among FSOs, FSRUs, Spars, and TLPs.
Challenges Ahead: Respondents to EMA’s inaugural floating production industry survey expressed cautious optimism for the future. Tight/shale investment has had a larger than expected impact on deepwater developments, with the competition for capital causing a number of offshore projects to be delayed or canceled. 25 per cent of respondents feel finding viable projects will be the largest challenge for the industry in 2014-15. Increasing capital costs will further test the economic viability of floating production projects.
Bright spots in Mexico and marginal fields: Survey respondents indicated Mexico as the region with the most growth potential after Brazil and West Africa. Based on an exclusive interview with the director general of Pemex E&P, Carlos Morales, the report says the future is bright, but will take some time to translate into a wave of new orders – likely 2016-17. “Around this time we also see an opportunity for marginal field developments. 131 jack-up drilling rigs are currently on order, with deliveries between 2014 and 2016. This may cause a decrease in drilling costs for fields in less than 100m of water, where the most popular development option is an FSO, in conjunction with a fixed platform or MOPU,” it says.
According to EMA’s managing director David Boggs: “While the pace of floating production system orders has been slower than expected, over $20 billion in contracts were still awarded last year. The orderbook had been increasing steadily since 2010, peaking at 71 units in mid-2013. Since then it has declined almost 10 per cent to 64 units. There has been a significant bifurcation in the industry, between large, high specification floating production units costing over $1 billion and smaller units costing under $500 million. Today’s average order requires significantly higher financial, engineering, and project management resources than in the past, pushing up the per unit cost. This is reflected in our analysis of EPC and leasing contractors – some with multiple contracts and others with idle capacity.
Meanwhile another report says floating production systems (FPSO, TLP, Spar) market will be worth $35.4 billion by 2018.
The floating production systems market will grow from an estimated $14.9 billion in 2013 to $35.4 billion by 2018 with a CAGR of 18.9 per cent from 2013 to 2018, says a MarketsandMarkets report.
Latin America: Largest market for floating production systems Latin America holds the largest market for floating production systems with the most number of offshore exploration and production (E&P) activities being carried out in Brazil. This region has also seen a rise in ultra-deep water discoveries, along with a further increase in investments from FPS operators in Latin America, thus, boosting its global position.
FPSO: Biggest market by type, FPSO is the single largest floating production system type used across the globe and is suitable at all depths. The FPSO dominates the entire Capex for the floating production systems market. FPSOs are expected to witness maximum number of installations and order bookings for the forecasted period. Latin America and Africa are the major regions where the demand for ultra-deep water FPSO has boosted the market.
Deep and Ultra-deep water discoveries: Exploration activities have increased in recent years and have shown tremendous results. There have been many deep-water discoveries since 2011 which have boosted the development of the FPS market. Deep-water explorations drive the oil industry which in turn has been profitable and an emerging factor for the growth of the floating production systems market. From the ultra-deep water exploration point of view, new discoveries in Latin America and Western Africa are expected to drive the future of the floating production systems market.
However, a report by Global Data Point points out the sector is hitting some headwinds that could impact future business opportunities. Presenting its outlook for the floating production system orders, the repor says that overall, this is a $20 to $30 billion annual market. But the sector is hitting some headwinds that could impact future business opportunities.
BACKLOG OF PLANNED FLOATER PROJECTS
About 243 floating production projects are in various stages of planning as of beginning May. Of these, 57 per cent involve an FPSO, 16 per cent another type oil/gas production floater, 23 per cent liquefaction or regasification floater and 5 per cent storage/offloading floater. Brazil, Africa and South East Asia (SEA) are the major locations of floating production projects in the visible planning stage. Global Data Point is tracking 50 projects in Brazil, 49 in Africa and 46 projects in SEA – 60 per cent of the visible planned floating production projects worldwide.
Around 25 per cent of the projects are at an advanced stage of development. They typically have either entered the Feed phase, pre-qualification of floater contractors has been initiated or bidding/negotiation is in progress. Award of the production floater contract in these projects is likely within the next two to three years. The remaining 75 per cent of the planned projects are in an early stage of development. Contract awards are more likely in the three+ year time frame.
FUTURE BUSINESS DRIVERS
The large number of projects at the ready-to-go stage is clearly a positive indicator for future floating production equipment orders. However, timing of the decision to proceed to contracting will be influenced by future underlying market conditions. Fundamentals driving future orders in the floating production market remain generally positive. World oil and gas demand continues to grow, crude pricing remains in the $100 to $110 range and deepwater drillers are operating at high utilization. But the sector is hitting competition from shale/tight oil and gas supply, energy companies have been cutting capital spending budgets and deepwater drillers are not quite as bullish as in recent past.
GROWING DEMAND FOR OIL AND GAS
On the positive side, global oil demand has grown at an average rate of 1.4 per cent annually over the past 20 years. With the exception of two years during the global financial meltdown, oil demand has increased year over year during this period. Growth in oil demand is widely expected to continue over the foreseeable future. The IEA, for example, sees world oil demand in 2035 growing to 101 mbpd, an increase of 11 per cent over today. Global natural gas demand is also growing. Gas consumption doubled between 1980 and 2010 and has grown another 13 per cent since. Over the past decade global natural gas consumption declined in only one year – 2009 as a result of the financial crisis.
The EIA sees world gas consumption growing at an annual rate of 1.7 per cent through 2040. ExxonMobil projects a 65 per cent increase in natural gas demand by between 2010 and 2040.
UNCONVENTIONAL OIL & GAS SUPPLY
But unconventional oil and gas resources are changing the supply landscape. Use of horizontal drilling and hydraulic fracturing to exploit oil and gas resources locked in shale, siltstone and mudstone, as well as production of oil from oil sands, has opened huge new sources of energy supply.
Nowhere is the development of unconventional oil resources more rapidly advancing than in North America. Between 2011 and 2014 the production of oil in the US and Canada increased 39 per cent, primarily the result of incremental production of shale/tight oil in the US and oil sands resources in Canada. As a result, production of oil in the US and Canada now accounts for 27.6 per cent of non-Opec oil production – up from 22 per cent in 2011.
Development of shale/tight oil resources outside the US has been much slower due to land rights issues, access to drill equipment, environmental opposition to fracking, etc. But the shale/tight oil revolution will undoubtedly spread beyond the US. Opportunities are too big to ignore. The EIA estimates that shale/tight oil resources worldwide total 345 billion barrels – and account for 10 per cent of global oil reserves.
The equally spectacular revolution in shale/tight gas production is changing global gas supply and is threatening the dominance of major players in the LNG sector. And like shale/tight oil, the shale/tight gas revolution is centered in North America.
Production of shale/tight gas in the US is projected to grow 52 per cent over the next decade. According to the EIA, shale and tight gas is expected to provide 71 per cent of US natural gas production in 2024, up from 61 per cent today. In 2024 the US is expected to be producing 22.5 trillion cubic feet (tcf) of natural gas from shale and tight rock formations – the equivalent of more than three times the current natural gas production of Qatar.
A substantial, though yet unclear, portion of future US gas production will be exported as LNG. BP expects that the US “will become a net LNG exporter from 2016, reaching a total net LNG export volume of 11.2 billion cubic feet pe day (bcfd) by 2035. “ExxonMobil sees North America shifting “from a net importer to a net exporter of natural gas by 2020 as production outpaces demand.”
Like oil, development of shale/tight gas resources outside the US has been much slower due to land rights issues, limited drill equipment, environmental opposition to fracking, etc. But the shale/tight gas revolution will undoubtedly spread beyond the US.
Significantly, the competitive balance is shifting in favour of shale/tight rock. The cost of drilling shale/tight wells is falling – and well productivity is increasing. Meanwhile, technical challenges of ultra-deepwater development, local content barriers and an overheated industrial base are forcing deepwater costs higher.
Global oil demand keeps growing, but growth in unconventional oil supply is pressuring future crude prices, energy companies are cutting back on capital expenditures, drillers are reporting market softening and shale/tight oil and gas opportunities are attracting investment resources that otherwise might be used for deepwater projects. Time will tell how these positive and negative drivers combine to impact future orders in the sector