


 16,836 MW of wind capacity was installed in 2020 in the US
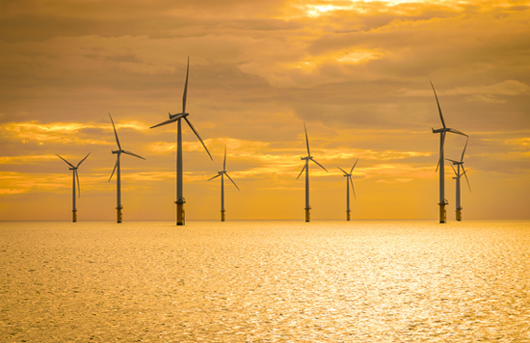
The average hub height for offshore turbines in the US is projected to grow even taller, from 100 m in 2016 to about 150 m, or about the height of the Washington Monument, in 2035, says reports by US Department of Energy (DoE)
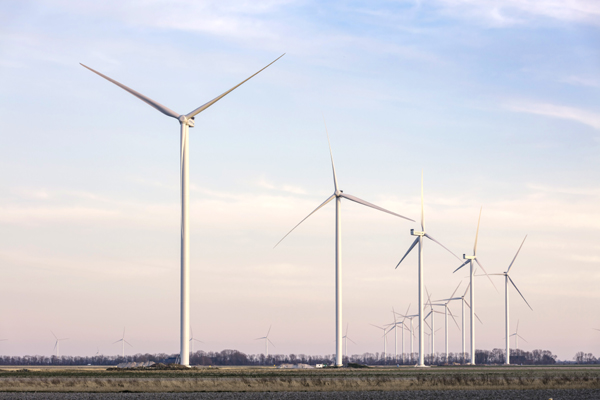
A wind turbine’s hub height is the distance from the ground to the middle of the turbine’s rotor. The hub height for utility-scale land-based wind turbines has increased 59 per cent since 1998–1999, to about 90 m (295 ft) in 2020. That’s about as tall as the Statue of Liberty.
The average hub height for offshore turbines in the US is projected to grow even taller – from 100 m in 2016 to about 150 m, or about the height of the Washington Monument, in 2035.
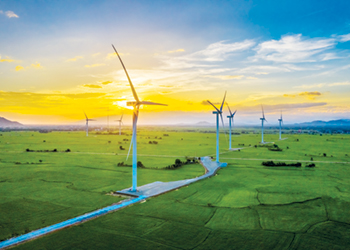
Turbine towers are becoming taller to capture more energy, since winds generally increase as altitudes increase, says reports by the Office of Energy Efficiency and Renewable Energy, an office within the US Department of Energy (DoE).
 |
Growing taller ... the height of offshore turbines is projected to grow |
The change in wind speed with altitude is called wind shear. At higher heights above the ground, wind can flow more freely, with less friction from obstacles on the earth’s surface such as trees and other vegetation, buildings, and mountains.
Most wind turbine towers taller than 100 m tend to be concentrated in the Midwest and Northeast, two regions with higher-than-average wind shear.
• Rotor diameter: A turbine’s rotor diameter, or the width of the circle swept by the rotating blades, has also grown over the years.
Back in 2010, no turbines in the US employed rotors that were 115 m in diameter or larger. In 2020, 91 per cent of newly installed turbines featured such rotors. The average rotor diameter in 2020 was about 125 m – longer than a football field.
 |
35,324 MW offshore wind power projects are in various stages of development |
Larger rotor diameters allow wind turbines to sweep more area, capture more wind, and produce more electricity. A turbine with longer blades will be able to capture more of the available wind than shorter blades – even in areas with relatively less wind.
Being able to harvest more wind at lower wind speeds can increase the number of areas available for wind development nationwide. Due to this trend, rotor swept areas have grown 570 per cent since 1998–1999.
• Nameplate capacity: In addition to getting taller and bigger, wind turbines have also increased in maximum power rating, or capacity, since the early 2000s. The average capacity of newly installed US wind turbines in 2020 was 2.75 megawatts (MW), up 8 per cent since 2019 and 284 per cent since 1998–1999. In 2020, there was a sharp increase for turbines installed in the 2.75–3.5 MW range.
More wind energy per turbine means that fewer turbines are needed to generate a desired capacity across a wind plant-ultimately leading to lower costs.
• Transportation/installation challenges: If bigger is better, why aren’t even larger turbines used currently? Although turbine heights and rotor diameters are increasing, there are a few limitations.
Transporting and installing large turbine blades for land-based wind is not easy, since they cannot be folded or bent once constructed; this limits the routes trucks can take and the radius of their turns.
Turbine tower diameters are also difficult to manage, since they may not fit under bridges or highway overpasses.
The US DOE is addressing these challenges through its research projects. For instance, the department is designing turbines with more slender and flexible blades that can navigate through curves in roads and rail lines that conventional blades cannot. It is also supporting efforts to develop tall turbine towers that can be produced on site, thus eliminating tower transportation issues.
INCREASING WIND POWER CAPACITY
Wind energy in the US grew at a record pace in 2020, representing the largest source of new additions to the US electric-generating capacity.
• Land-based wind market: A record 16,836 MW of US wind capacity was installed in 2020, bringing the cumulative total to 121,955 MW.
Wind power installations outpaced those in solar power for the first time in several years and represented $24.6 billion of investment. Wind provides more than 10 per cent of electricity in 16 states, and over 30 per cent in Iowa, Kansas, Oklahoma, South Dakota, and North Dakota.
Improvements in the cost and performance of wind power technologies, along with the Production Tax Credit (PTC), have driven wind energy capacity additions, yielding low-priced wind energy.
The PTC provides a corporate tax credit of 1.3 cents/kWh for electricity generated by qualified renewable energy resources.
Wind turbines continued to grow in size and power, with the average nameplate capacity of newly installed wind turbines at 2.75 MW — up 8 per cent from 2019 and 284 per cent since 1998−1999. The combined health, climate, and grid-system benefits of wind are almost three times its levelised cost of energy.
• Offshore wind market: Driven by falling offshore wind prices, federal action, and state-level commitments, the US offshore wind pipeline grew 24 per cent over the previous year, with 35,324 MW now in various stages of development.
With the installation of the Coastal Virginia Offshore Pilot project, this now includes two projects totaling 42 MW in operation.
The Bureau of Ocean Energy Management created five new Wind Energy Areas in the New York Bight with a total 9,800 MW of capacity, representing a large portion of the 2020/2021 pipeline growth.
Massachusetts' Vineyard Wind I became the first approved commercial-scale offshore wind energy project in the United States.
There are 15 projects in the US offshore pipeline that have reached the permitting phase, and eight states have set offshore wind energy procurement goals totaling 39,298MW by 2040.
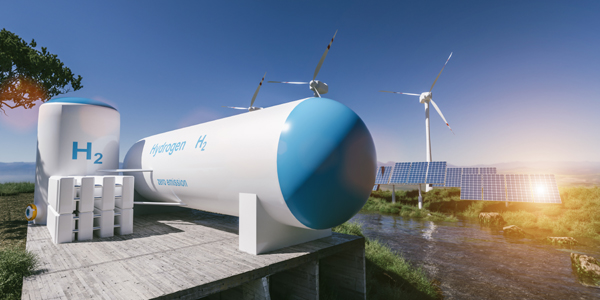
Global offshore wind installations in 2020 totaled 5,519 MW. Turbine sizes continued to grow, with average rotor diameters exceeding 150 m and turbine capacities more than 7.5 MW. New trends also emerged in 2020, including increased interest in using offshore wind to produce clean hydrogen. The global pipeline for floating offshore wind energy more than tripled in 2020 to 26,529 MW.
• Distributed wind market: The US distributed wind sector – which includes power from wind turbines installed near where the power will be used – added 14.7 MW of new distributed wind energy capacity with 1,493 new wind turbines installed across 11 states.
This capacity represents $41 million in investment and brings the total installed capacity to 1,055 MW from more than 87,000 wind turbines across all 50 states, Puerto Rico, the US Virgin Islands, and Guam.
US-based manufacturers of small wind turbines (100 kW or less) accounted for 71 per cent of the domestic, small wind sales capacity in 2020.
Small wind turbine retrofits–new turbines installed on existing towers and foundations–have become more common, accounting for 80 per cent of small wind capacity additions in2020.