


 Figure 1 … H2S and SO2 gas absorbance spectra representative of sulphur pit analysis
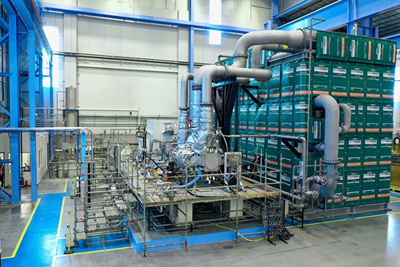
Advanced spectrometry ensures precise chemical measurements, enhancing efficiency and output in hydrocarbon processing while minimising emissions in refineries and chemical plants, writes Dr Harry Burton
In modern chemical plants, hydrocarbon processing facilities and refineries, continuous innovation can separate successful operations from those that are not.
Processes that increase safety, reduce emissions, have greater product output, and generate increased profit margins, are constantly researched, designed and implemented.
Data analysts, especially those with backgrounds in chemistry, engineering, and physics, have spent decades gathering and reviewing information from plant information systems in search of opportunities to modify and improve plant operations.
An ongoing practice is reviewing chemical compounds and their concentrations throughout operations.
Monitoring and understanding how both chemical compositions and concentrations change in process streams as they pass through heaters, across catalysts, or are subjected to changing levels of pressure enables system designers to make positive changes in current operational configurations or practices.
There are challenges, however, when the desired data is not available. Sometimes the lack of data is caused by an inability to continuously or accurately measure compounds of interest.
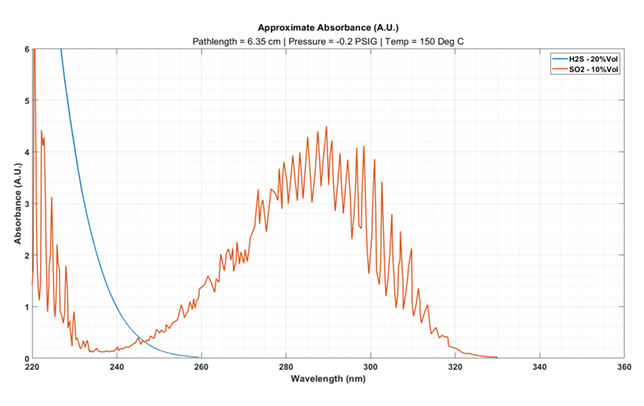 |
Figure 2a … H2S and SO2 gas absorbance spectra when measured after the first condenser of the SRU Claus Unit. |
In the early times of embedding process analysers in plant operations, just obtaining any information was 'good enough'.
But computational improvements and the introduction of new measurements technologies in process analysers have driven automation professionals to require more information that was once considered unattainable.
As such, complex analyser suppliers like AMETEK Process Instruments can never be satisfied with what its equipment is currently capable of accurately measuring.
Sometimes, when an automation professional wants to know how much 'Analyte X' is present at previously unmeasured locations, we do not need to identify a new measurement technology or integrate a faster processing chip.
We can begin to address their request by starting with the most basic 'laws' of chemical analysis, such as Beer’s Law.
Before tackling the principle of Beer-Lamberts Law, there is a need to understand how an analyser functions; specifically, how a spectrometer can allow the analyser to measure components at their respective concentrations.
Spectroscopy is the measurement of light (or spectra) and its varying behaviours under certain conditions.
Spectrometers are commonly used for gas analysis but can also analyse liquid phase samples as well.
Many spectrometers will include a light source, sample cell, detector, and a variety of optical components that ensure precise and accurate measurement.
The goal is for the source light to reach the detector after interacting with the chemical sample within the cell, thereby producing an absorbance response.
Absorbance (A) is transmitted light that has been retained by a particular substance or object and can be related back to light transmission (T) through this equation:
I is the intensity of the returning light source (as measured by the detector), while Io is the initial light intensity.
Beer-Lambert’s Law, or – more simply – Beer’s Law, is both a Physics and Chemistry-based principle that relates a chemical’s absorbance to its concentration.
The formula below is the commonly known form of this principle:
Here, ε (epsilon) is the chemical’s molar absorptivity (or extinction coefficient), c is the chemical’s concentration, and l is the pathlength of the sample cell.
Molar absorptivity is a constant that defines how absorbative a chemical is at certain wavelengths.
For example, hydrogen sulphide (H2S) absorbs strongly at wavelengths of less than 250 nm.
Concentration is self-explanatory, but the sample cell pathlength plays a key role in a chemical’s absorbance response.
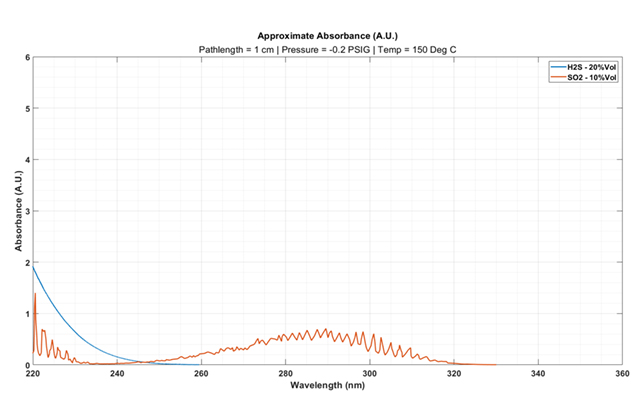 |
Figure 2b … H2S and SO2 gas absorbance spectra when measured after the first condenser of the SRU Claus Unit. |
By adjusting the length of the cell, the interaction time between the light and sample cell molecules increases. This magnifies the absorbance response, allowing for lower limits of detection.
To showcase this behaviour, two scenarios of how careful pathlength selection is critical for measurement will be observed.
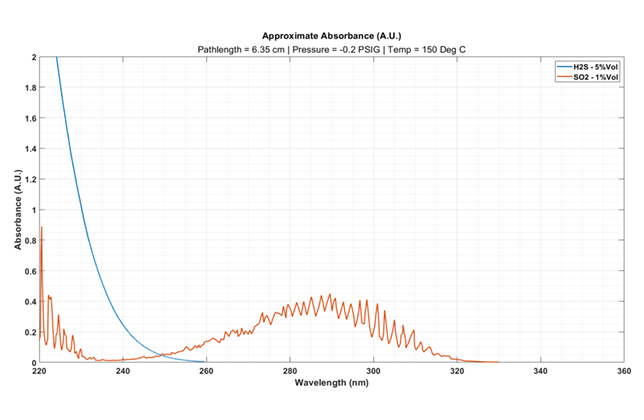
In scenario 1, a plant operator wants to monitor both H2S and SO2 within the sulphur pit of their sulphur recovery unit (SRU).
Liquid sulphur will degas H2S contained within its solution, which accumulates in the pit’s headspace.
Monitoring this accumulation is crucial, as H2S can pose an explosive hazard if it reaches its lower explosive limit (LEL), which is 3.5 per cent volume. SO2 is also monitored to signal for smouldering pyrophoric sulphur fires.
Traditionally, such measurements require full-scale ranges of 0-1 per cent Vol SO2 and 0-5 per cent Vol H2S.
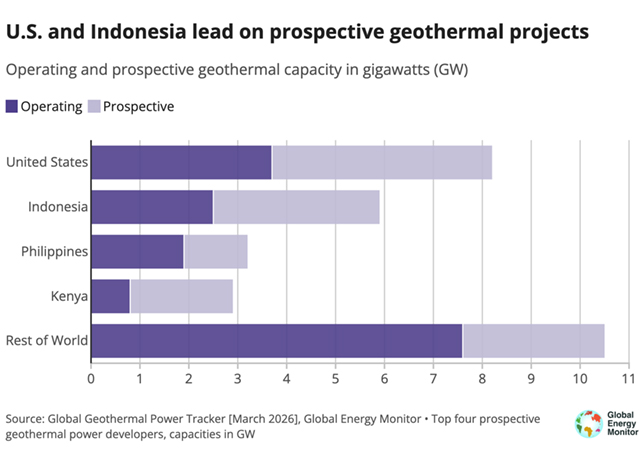
To achieve this, an analyser can utilise a 6.35 cm pathlength sample cell. Figure 1 provides an illustration of the resulting absorbance spectra.
SO2 also produces a strong absorbance at near similar wavelengths as H2S. This cross-interference in absorbance can be mitigated via regression modelling.
Figure 1 … H2S and SO2 gas absorbance spectra representative of sulphur pit analysis
The spectra in Figure 1 shows several viable wavelengths to measure for calibration.
Now let’s look at a second scenario: A plant operator wants to monitor upsets in their Claus unit after the first condenser. Concentrations of 20 per cent Vol H2S and 10 per cent Vol SO2 (or greater) can be present at this measurement location.
If the same pathlength cell from scenario 1 is used (Figure 2a), a significant increase in the absorbance response is observed.
Absorbances of 1.5 or greater results in significant loss in transmitted light back to the detector, which can lead to noisier concentration outputs. This is not ideal, so a shorter path length cell should be considered.
Integrating a significantly shorter path length cell (such as a 1cm cell), as shown in Figure 2b, results in a significant decrease in the total absorbance response.
Through careful consideration of the chemical species of interest, process conditions (such as temperature and pressure), and the application of Beer’s Law, there’s a great deal of latitude in how a measurement can be made.
It’s important that the correct light sources and detectors are chosen for absorbance generation and detection just as it is in selecting the appropriate sample cell length.
By manipulating these materials, process instrument manufacturers can measure a multitude of species, meeting the demands of end-users.