


Volume-based interpretation and visualisation VoxelGeo
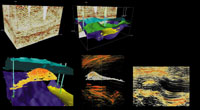
VoxelGeo uses voxel technology to provide rapid volume-based analysis of seismic and attribute cubes of data. Voxel technology was originally developed for the medical industry, to image the internal structure of the human body from CAT scans.
At its most basic level, voxel technology is used to visualise a 3D matrix of points. 'Voxel' is an acronym for a 'Volume Element' or, if you prefer, 'Volume Cell'.
Each voxel is centred about a location in space (or time), and has a corresponding attribute value, commonly the strength of the rock's response to a sound pulse at that location.
Voxels are regularly gridded which gives them effective volume, and colour coded according to the value of their attribute.
They can then be stacked on each other to build up three-dimensional images of the subsurface.
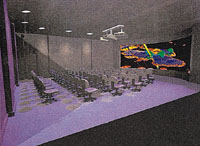
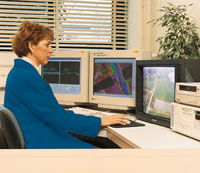
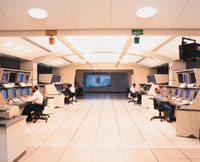
These results can be created and analysed on single user workstations or presented interactively in discussion groups in the visionaria system which many oil companies are now installing.
Visionaria commonly use the technology of voxel rendering to produce wall-sized displays of the seismic or attribute volume.
Exploration or reservoir management teams can feel themselves immersed in these volumes and ancient environments they are investigating.
Discussion between drilling engineers, reservoir technicians, geologists and geophysicists and senior management can be conducted quickly and efficiently with direct data interchange without the need for numerous workstations.
According to Littman, oil companies applying this approach report dramatic increases in productivity.
Processes that literally took months of disparate intra and inter group discussion can now be condensed into days of work within a visionarium.
''Three-dimensional visualisation is probably the most exciting new approach to discovering and managing hydrocarbon reserves.
No longer do oil companies have to stare at walls of seismic volumes, but can effectively use these specialist techniques to see through to a much larger and more detailed visualisation of seismic data,'' concluded Littman.