


.jpg) Floating Wind Energy Projects of the World Map
Floating Wind Energy Projects of the World Map
A report from Quest FWE has forecast exponential growth for floating wind energy; potentially 180 GW of installed capacity by 2050, comprising 13,000 floating turbine units.
Floating wind is a young industry with 15 units currently online representing 9 projects and only a decade of work. It has come a very long way in just a few years delivering new floater designs, scaled demonstrators, pre-commercial projects and new players.
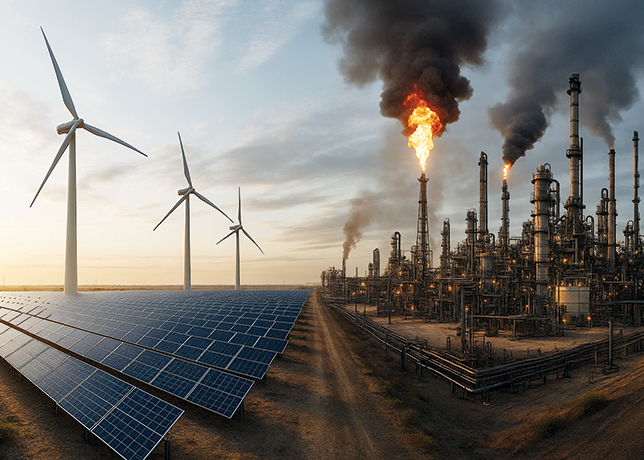
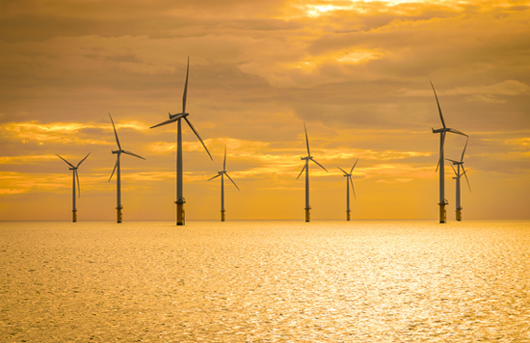
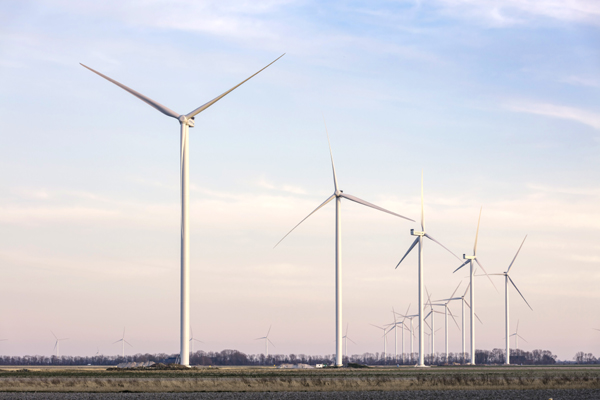
Overall, wind represents a vital component of renewable power generation, with many countries looking to harvest larger volumes of it.
The ‘Global Floating Wind Market and Forecast Report 2021-2034’ report said that by 2020-end the total installed global offshore wind capacity reached 32.5 GW. The top five offshore wind markets in terms of capacity in operation are the UK (10.4 GW), Germany (7.7 GW), China (7.1 GW), The Netherlands (2.6 GW) and Belgium (2.3 GW).
The offshore wind sector was until recently developing only ‘bottom-fixed’ structures in shallow water, near-to-shore. However, with the advent of floating wind, there will be new developments further from shore and in deeper water.
Floating wind projects increased 61 per cent year-over-year, from January 2020 to January 2021, with capex gains of $33 billion. Spending in the Asia Pacific and Northern Europe was $19 billion and $17 billion, respectively.
Over the forecast period, more than 26.2 GW of floating wind projects are scheduled for commissioning worldwide to 2035.
The floating wind market to 2035 is sizeable representing $96 billion spending for forecast wind power capacity additions of 26,207 MW comprising 2,656 floating turbine units (FTUs).
Currently under development are five super-sized floating offshore wind projects ranging between $800 million and $2 billon. These represent 7 per cent of the $96-billion total addressable market of presently identified under development, planned and possible projects.
Worldwide spending by supply chain segment over the forecast period consist of $36.4 billion for turbines, $22.5 billion for substructures, $14.7 billion for mooring systems, $11.6 billion for subsea power cables and over $2 billion in installation activities.
According to Quest FWE’s proprietary Q Vision database, near-to-medium-term projects account for 1,000 cumulative floating units with about 750 projected to be online between 2025-2026.
Capex is led by the Asia/Pacific region with $25.2 billion, followed by Northern Europe with $11.3 billion, US-Pacific with $6.2 billion, Southern Europe with $2.4 billion and the US-Atlantic $300 million.
OVERALL OFFSHORE OUTLOOK
In total, 21,117 wind turbine generating units are forecast globally to 2035 signifying a nameplate capacity of 207,741 MW and capital spending of $609 billion.
Quest has identified projects representing more than 208 GW of offshore wind scheduled for commissioning worldwide during the period.
While the mix between fixed and floating is 85 per cent to 15 per cent, respectively (on a MW basis), a regional analysis signifies a 43 per cent share of capital spend to Europe followed by AsiaPac at 37 per cent, and The Americas with a 20 per cent portion.
A year-over-year comparison to the global opportunity pipeline sees spending gains exceeding $180 billion with new bottom-fixed wind projects surging in all core regions. Of this, Asia Pacific will spend $70 billion, Europe $61 billion and the Americas $50 billion.
Globally, the 50 per cent increase in turbine units to 18,038 was led from Europe with the addition of 2,243 units followed closely by AsiaPac with 2,331 and The Americas seeing a net gain of 1,470.
The Floating Wind Energy Projects of the World Map can be downloaded from: https://questfwe.com/map-2022/