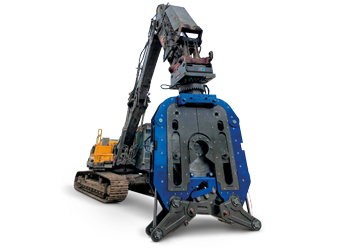


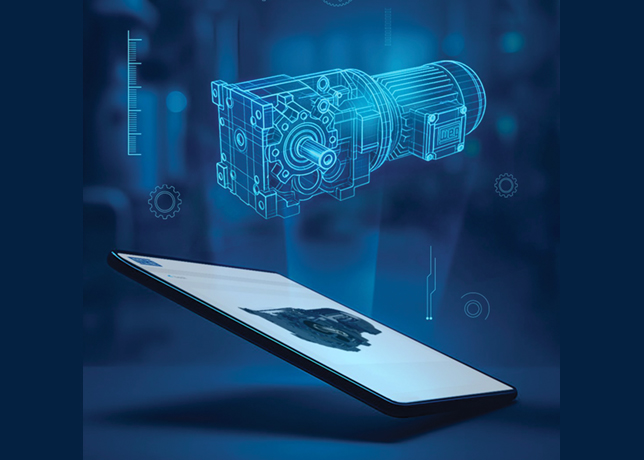

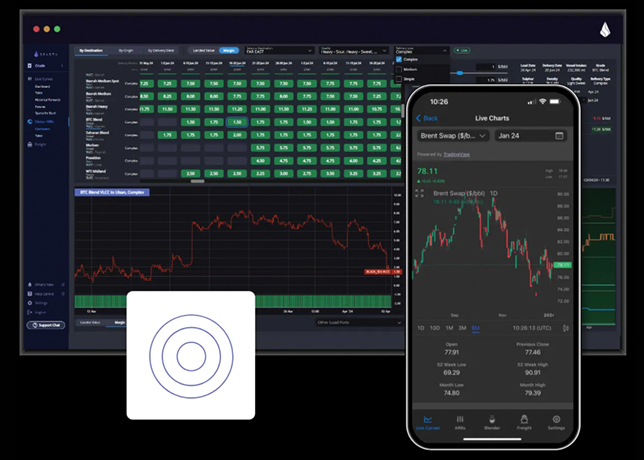

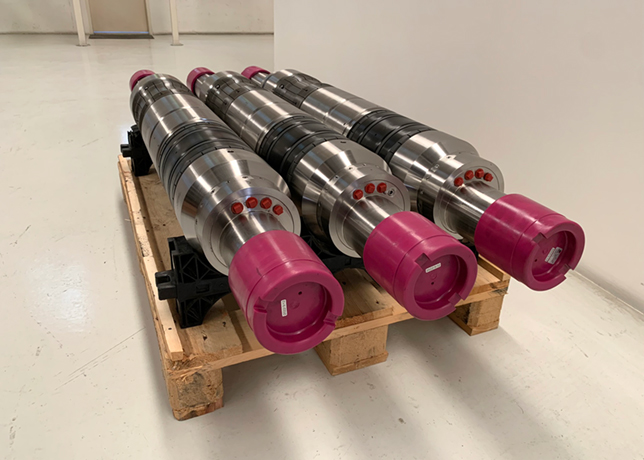


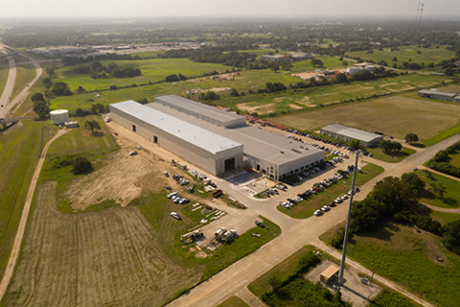


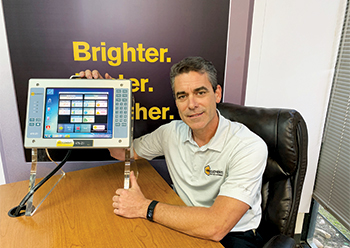
 The RIGS system is one component of the Ranger Live Mobile Platform
Data acquisition systems, such as Ranger RIGS, developed by Ranger Energy Services, can deliver wellsite metrics to benchmark operational performance and improve efficiency, Mark Haubert, Vice President of Business Development, Marketing & Technology, Ranger Energy Services, tells OGN
Since the 1980’s, digital monitoring systems have been developed for oil and gas drilling rigs to capture data from downhole sensors using wireline logging and measurement while drilling tools.
Today, these systems have evolved into advanced drilling, data acquisition, control, automation and monitoring systems.
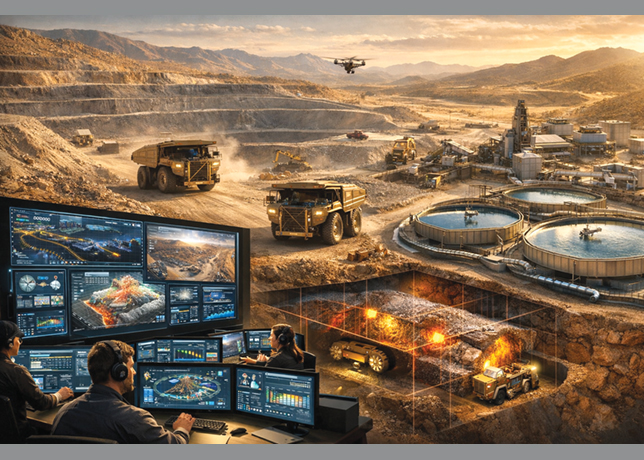
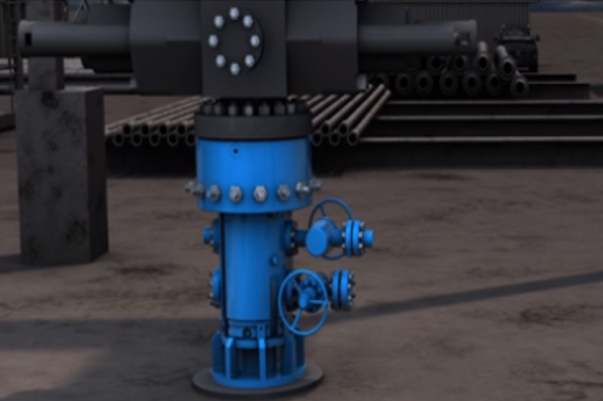
State-of-the-art automated rigs capture data and control the rotary system, pipe handling and makeup, top drive and hoisting system, fluids management and circulation systems, rotary steerable systems, well control systems, power systems and third party systems.
Today’s drillers manage the drilling process from an automated driller’s cabin where they monitor and manage the integrated drilling systems with touch screen and joystick controls. Further, these automated rigs are monitored from anywhere in the world.
Meanwhile, operators who are developing unconventional resources with long lateral well completions are requiring operational data to benchmark and optimize performance, but the well servicing segment has not adopted these drilling technology advancements.
DIGITAL TRANSFORMATION
In 2018, Ranger Energy Services (Ranger), a premier provider of well completion and intervention solutions in the US, began collecting the operational data and metrics to benchmark and improve performance.
 |
Ranger engineers, management and customers access real-time data from the |
Initially, a worksheet based report was developed to capture completion and frac plug drillout data pertinent to the operation. The data from this spreadsheet was submitted via email to a central engineering team who could review it. The engineers would then evaluate operational performance, compare data with other internal benchmarks, identify opportunities for improvement, and prepare a post-job report. Finally, the team would warehouse the data for reference against future operations.
The next evolution was to automate the worksheet process and provide digital, real-time access to operational metrics and activities.
Ranger personnel from engineering, IT and operations collaborated to define a system that would meet internal requirements.
The company’s engineering and IT teams worked with an external resource to develop the initial system functionality to align with worksheet based reporting. Engineering and operations then conducted a field test phase of the software and hardware under live operating conditions. This phase enabled the team to refine the sensors, hardware, user interface, and software functionality.
RIGS SYSTEM FUNCTIONALITY
The result was Ranger RIGS (Ranger Information Gathering System) data acquisition system.
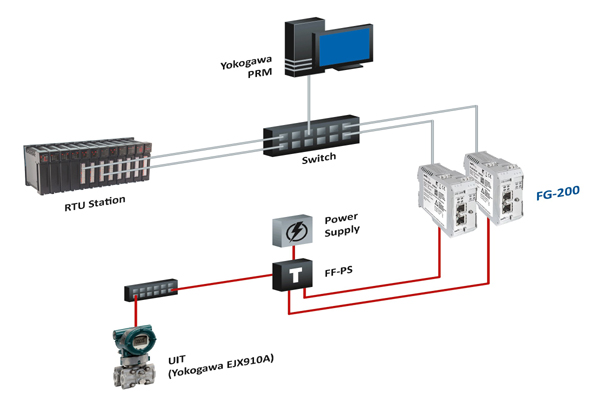
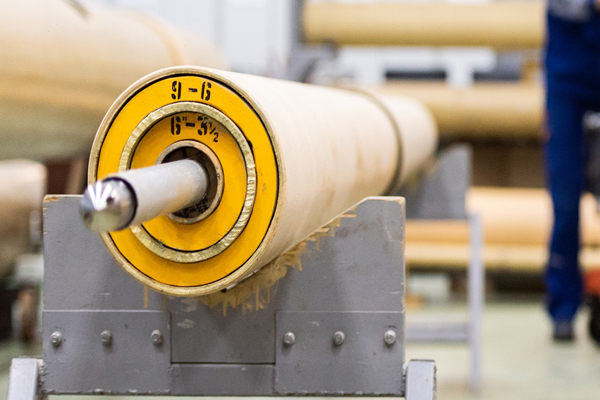
RIGS consists of sensors on the rig and ancillary equipment that gather data metrics such as pump rates, pressures and volumes, weight, depth and torque. Operational alarms can also be set to notify personnel when parameters are nearing or exceed the desired operational range.
The data is collected on location and is transmitted via the cloud to our engineers and managers as well as customers, wherever they are located. This data provides remote, real-time visibility to the operation that is taking place at a wellsite.
Specifically, RIGS captures and calculates the following parameters:
• Block position, string weight and complete cycle tripping depth.
• Tong torque and swivel torque.
• Pump rate, pressure, volume and temperature into the well.
• Return rate, wellhead pressure, volume and temperature out of the well.
RANGER LIVE
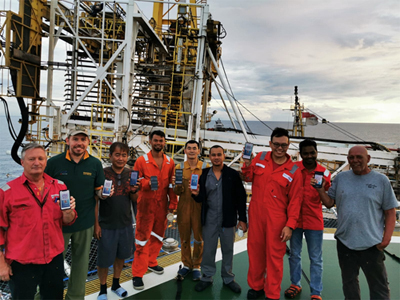
The RIGS system is one component of the Ranger Live Mobile Platform, a customised suite of applications available to field crews at the job site via tablet or other mobile device. The suite includes a safety and quality system, a vehicle tracking and driver behavior management system, an electronic ticketing system, a preventive maintenance management system, and the RIGS data acquisition system.
Data for each system is captured on-site, transmitted via cloud-based internet, stored on Ranger’s secure sequel servers, and is made available for access on any laptop, tablet or smartphone device.
CLOUD PORTAL
Users who have been granted access can log in to a cloud portal where they can view live RIGS data. Users will be able to see a list of all rigs they have been granted access to, along with the rig locations plotted on a map. The user can then select a specific rig to view RIGS data in real-time.
Upon selecting a rig, the primary dashboard will open for live data observation of current rig operations. The dashboard presents raw and calculated values generated by the RIGS system including a table of the operational activities with start and stop times entered into the system by the rig operator, and a graphical representation of various data inputs in real time.
The cloud portal includes several additional tabs that present specific data in chart format for the previous 24 hours. A second tab includes a chart that presents string weight, tong torque, depth, and pump rate in. A third tab includes a chart that presents the block travel and depth. A fourth tab includes a chart that presents the discharge pressure from pumps, the rate into the wellbore, and the return rate.
DYNAMIC REPORT
A dynamic, interactive time report is available allowing the user to prepare a report for a duration of up to 28 days. The amount of time spent on each activity during the timeframe is presented in a table, a timeline graph and a time donut chart. Users can also view the Weight/Pressure/Depth chart, the Block Position chart, the Discharge Pressure and Rate chart, and a list of the rig operator’s activity annotations for the specific timeframe.
MONITORING & REPORTING
Operations control centre engineers can monitor performance across multiple rigs to identify anomalies and to provide technical support in real-time. Management can also view real-time data and dashboards for daily reporting, situational awareness and decision-making. Post-job reports can be prepared and compared to pre-job plans. Finally, the data is archived and used to benchmark operational performance, identify opportunities for improvement, and implement plans to improve efficiencies.
ENHANCING OP PERFORMANCE
Ranger RIGS data acquisition system can deliver live, digital wellsite metrics to benchmark operational performance, identify opportunities for improvement, and implement plans to optimize performance.
Engineers, operations managers and customers can view live RIGS dashboards via a cloud portal to monitor progress and performance across multiple operations and to provide technical support.
Monitoring real-time data from completion and production service operations can offer many potential benefits. These benefits include the ability to improve quality and safety performance, provide technical support, provide troubleshooting and coaching, reduce non-productive time, identify best practices, conduct analytics and trend analysis to benchmark operational performance, identify and implement operational efficiency improvements, and reduce operating costs.
Ultimately, RIGS will deliver consistent and repeatable performance that is scalable across multiple locations and regions on a platform that is capable of driving further efficiency gains. Finally, a dynamic, interactive time report is available to visualize all metrics for a desired time frame and to prepare post-job versus pre-job planning reports.
This latest data acquisition system for the well servicing segment is a transformative technology for augmenting operational performance in the oil and gas industry, providing real-time access to active operations, while enhancing managements' ability to more effectively arrive at decisions that support operational performance and safety.