


There is an increasing demand for detailed geological numerical models, which incorporate all available data into reservoir characterisation studies for the purpose of fluid flow simulation.
Conventional modeling techniques, which lack the ability to quantitatively integrate data, tend to produce homogenous results of reservoir properties in the interwell regions.
These models, when fed into reservoir simulations for performance predictions, may generate biased and unreliable results.
This necessitates the development of a method that integrates all available data, despite differences in scale, improving the predictive power of the models and making it possible to obtain quicker production history matching from reservoir simulation.
Geostatistical tools can use data such as 3D seismic to directly or indirectly contribute to the modeling of interwell regions, providing significant risk reduction in reservoir development and management.
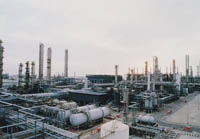
The geostatistical methodology described here in the Hawtah field has been adopted for integrating geophysical, geological and engineering data in reservoir modeling.
Hawtah is a recently developed field with a wealth of modern geological, petrophysical, geophysical and production data. Incorporating all of this information into the reservoir model exceeded the capability of conventional numerical models.
'Unayzah reservoir architecture
The 'Unayzah reservoirs in the Hawtah field are composed largely of rocks of continental origin, organised in a highly complex fashion.
Untangling their complex facies architecture has required passing through several evolutionary stages.
More recent detailed stratigraphic and sedimentological studies suggest that the rock architecture of the 'Unayzah reservoirs is much better organised than originally believed.
A sequence stratigraphic scheme can be applied to allow a better understanding of reservoir prediction and connectivity for most parts of the reservoirs.
The 'Unayzah reservoirs can be divided into three major units: the basal Lower 'Unayzah (B), the middle Upper 'Unayzah (A), and locally well-developed basal Khuff clastics on top.
The Lower 'Unayzah (B) and underlying pre-'Unayzah sequences represent sedimentary successions composed of dry and wet alluvial fan and also associated glaciofluvial deposits.
The sediments of 'Unayzah (A) signal a major shift in depositional and tectonic styles from underlying 'Unayzah (B) sandstones. The principal reservoir unit of the 'Unayzah (A) shows individual cycles with upward-cleaning characteristics, most commonly starting with trangressive lacustrine and associated sabkha and interdune facies in the lower parts, followed by aeolian, and locally by ephemeral fluvial channel deposits in variable proportions.
These cycles represent overall upward-drying sequences developed in response to fluctuating climatic conditions.
The youngest reservoir unit, the Basal Khuff, is characterised in the study area by localised lowstand incised valley fill sandstones, which form locally prominent high-quality reservoir bodies.
'Unayzah rock model
Examination of reservoir properties such as porosity and permeability for their different depositional environmental facies indicated substantial overlap between them, so this could not be used alone to determine reservoir flow units.
An in-house cluster analysis was thus used to establish petrophysical rock types for all the wells utilising eight electric log curves. These rock types were then cross-referenced with the core data.
The result showed three main petrophysical rock types with a distinct reservoir quality for each one: namely reservoir-rock (rock 1), an intermediate rock type (rock 2), and non-reservoir rock (rock 3).
Univariate statistics of porosity for each rock type showed clear separation between each class of porosity as indicated in histograms.
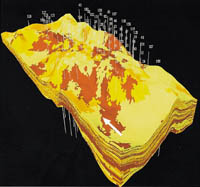
An attempt was made to build a 3D petrophysical rock model as defined at the wells, but the resulting model has no geological character or meaning. Therefore, it was decided to combine both the environmental/depositional facies model built earlier, fully supported by the geologist, with the petrophysical rock type model, supported by the reservoir engineer, into a single integrated facies model.
This was accomplished by distributing the petrophysical rock types defined at the wells within each environment of depositional facies separately. Figure 1 shows the resulting 3D model of petrophysical rock type distributions utilising a depositional environmental facies model as regions.
Stochastic seismic inversion
A post-stack amplitude inversion was performed on the 3D Hawtah seismic volume to incorporate seismic impedance data into the 3D Hawtah model.
This transformation and integration explicitly considered that seismic-based information is an imperfect predictor of well impedance logs and, subsequently, an even less perfect predictor of facies.
The stochastic inversion approach capitalises on stochastic simulations such as Sequential Gaussian Simulation (sGs)-including collocated cokriging to generate multiple, equi-probable realisations of impedance pseudo-logs at each seismic trace location and then selecting the closest one to the actual seismic trace.
Moreover, the stochastic inversion approach honours the constraining well impedance logs along with their vertical resolution as well as the specified univariate and bivariate statistics of impedance by area and/or zone.
Elements of the inversion processing of the 'Unayzah reservoir included a simultaneous wavelet estimation and timedepth analysis, zero-phase broadband reflectivity processing, 3D forward modelling of low-frequency reflectivity balancing and impedance fields, deterministic inversion, and a high-frequency log-scale stochastic simulation of impedance constrained by the deterministic inversion. The result is an impedance model at the same scale of resolution as the well logs.
A seismic horizon picked at the top reservoir, combined with time-to-depth relationships determined from log-to-seismic-ties, was used to convert the geological model layering scheme to seismic micro-horizons within the reservoir, and to estimate the seismic wavelet.
Time-to-depth conversion
Reservoir modelling is carried out in the depth domain, which requires the conversion of seismic acoustic impedance (AI) from the time-to-depth domain. The conversion can be done by simply snapping the impedance values between two markers, which are equivalent to the same depth markers, into a pre-defined 3D grid.
In the case of the 'Unayzah model, the geological 3D reservoir grid model was defined in depths utilising all the 13 zones and an areal grid which covers the field outline. The total number of vertical cells (layers) is 133 with an areal grid of 113 in the x direction and 217 in the y direction, making the model size more than three million cells in total.
AI data among each of the 15 zones (which are available in time domain) was snapped to the corresponding 15 zones in depth. This conversion from one domain to another is considered as an implicit one, unlike the conventional velocity-based 217 cells conversion.
AI porosity relationship
Well data was thoroughly examined by means of univariate and bivariate analysis such as histograms and scattergrams, respectively, to look for a systematic relationship between well AI and porosity.
There was evidence of a strong AI and porosity relationship once the data was segregated by petrophysical rock type, showing that the better the reservoir quality rock (rock 1) the higher the correlation coefficient between porosity and AI. However, in the non-reservoir rock type (rock 3), the relationship between the two variables is lost. As a result facies modeling plays a major role in determining how much weight the seismic should have to influence the estimation of porosity in the interwell regions.
Porosity and permeability modelling
A 3D porosity model was built using the high-resolution impedance model and utilising the proper correlation coefficient for each rock type as defined in the 3D petrophysical rock model built earlier.
This was accomplished through the use of sGs of porosity with collocated cokriging using AI as soft data.
The sGs was chosen for its ability to generate models of porosity, which capture the heterogeneity of the reservoir as well as its power to generate multiple realisations of modelled porosity models, which can be ranked for use with fluid flow simulation tools, such as streamline simulation. In the case of 'Unayzah reservoir, only one realisation of porosity was selected for fluid flow simulation for practical reasons.
Permeability curves were constructed for each well in the Hawtah field honouring both the permeability thickness from pressure buildups, flow meter profiles and core permeability data. The flow profile is used to allocate the total or gross measurement of pressure buildup to a higher resolution permeability log.
The newly produced permeability log is then integrated with core porosity and permeability data for each facies to overcome the problem of missing data at non-perforated intervals of the well. The integration is accomplished-by assigning permeability values from cloud transforms of core porosity and permeability.
In non-perforated intervals, however, facies-based cloud transforms are used to randomly sample possible permeability values from the core data for a given porosity class.
A 3D correlated probability field was generated from the existing conditioned permeability logs at each well location. The correlated probability field is then used to sample the cloud transforms for each facies. For a given porosity value corresponding to the existing facies-based porosity model it then assigns a permeability value. The result is a permeability model that both honours the engineering data at the well location (permeability from pressure buildup and flow meter) and retains core porosity and permeability characteristics for each facies. Stratification of the 'Unayzah reservoir is better captured this way than using conventional techniques.
Conventional models
Two sets of porosity and permeability models were constructed using the interpolation methods of least squares and inverse distance and a linear transformation of porosity to permeability.
Porosity was distributed between the wells using the inverse distance for the same 3D gridded integrated framework.
The permeability model was built by directly transforming this porosity model. A regression line was fitted through the cloud of core porosity and permeability values by averaging the distribution of permeability for a given porosity value. This linear relationship was then used to transform the porosity model.
Fluid flow performance
To determine the level of accuracy between the two approaches and the advantage of data integration, fluid flow simulations were run.
The simulation models were constructed using permeability, porosity, depth and cell thickness and petrophysical rock types. No upscaling was done on either set of models to eliminate any inherent errors associated with upscaling.
Relative permeability curves and capillary pressure curves were built for each rock type. The global porosity of rock types were split into five bins for simulation modelling. Water injectors were placed at the down-dip ends of the structure while oil producers were placed on the structural high.
Water floods were modelled using a streamline simulator with the porosity and permeability distributions obtained from both the conventional and the integrated approach.
Quick-look water flood simulations provided water breakthrough times, fluid front behavior and water cut comparisons. A detailed fluid flow simulation was also carried out using a finite difference simulation technique for both approaches to assess the required CPU time for history matching and pressure and error analysis comparisons.
Results
Each set of models produced very different flow results in terms of water breakthrough times and fluid movement patterns.
For integrated models, water had a preferred direction through thin zones of high permeability capturing the stratification of the reservoir model and more closely matching well observations.
By contrast, for the conventional approach the fluid front movement has no preferred direction throughout the model, because the conventional reservoir model is more homogenous compared to the integrated model.
The fluid flow simulation results seem to indicate a significant impact on levels of accuracy in both history matching time and well performance.
The error at each time step for the integrated model is smaller and more stable than the errors from the conventional non-integrated model. Another advantage of the integrated approach is clearly seen in the improvement of simulation speed for every time step, with as much as 17 per cent savings of computational time without changing the properties of the model.
The above article appears courtesy of The Saudi Aramco Journal of Technology.