


 multiple cross sections of % dolomite
A PROJECT was undertaken at Saudi Aramco to develop a quantitative definition of super-K; map this quantitative definition of super-K and compare to other geological and reservoir properties; determine a possible correlation between the data in order to determine what parameters may be influencing super-K events; and use 3D visualisation to review the data to determine if there are trends or similarities in the data.
Using all open-hole flowmeters in the 'Uthmaniyah area, a Fluid Flow Index (FFI) was calculated.
The FFI is based on the derivative of the flowmeter and was calculated at every one-foot interval for all 'Uthmaniyah wells. An FFI was calculated for both the oil and total rate and each was normalised to unity using the highest calculated value.
To incorporate the effects of rate, each FFI was multiplied by the respective rate, oil or total.
These were also normalised to unity, again using the highest calculated value for each index.
The four indices were mapped at every 0.3 m interval. Geological, geophysical and observed reservoir performance data were also mapped and compared to the FFI data. This data included dolomite per cent, PI data, KH data, fault interpretations, well rate data, net oil contours, pressure isobars, water flood fronts and individual well logs.
The data was then visualised in 3D stereo using GOCAD, which was extremely useful in identifying trends and anomalies.
Project scope and overview
To better understand the quantity of data used in this study it is important to note that there were 1,366 'Uthmaniyah wells analysed.
This represents about $82 million-worth of open-hole logging cost. A total of 799 wells had flowmeters run at a total cost of $16 million, of which 462 wells were open-hole flowmeters.
The majority of these wells had several and some as many as 16 open-hole flowmeters. Since a data point is taken at every 0.3 m interval, measuring both water and oil, this translates into approximately 2.5 million data points that were used in this study.
This data was retrieved from the Saudi Aramco corporate database and stored in GEOLOG datasets.
The past definition of super-K events was 500 barrels per day per foot, and was observed through loss circulation or a high kick in the flowmeter.
A new and quantitative definition of super-K was needed, which would distinguish, for example, the difference between 500 and 1,500 barrels per day per foot.
After some discussion, the idea of taking the derivative of the flowmeter would be the best way to determine high flow intervals.
Therefore, all openhole 'Uthmaniyah flowmeters were extracted from GEOLOG. Since they were all digitised, the derivative could be calculated for every 0.3 m interval using specially written scripts.
It was noted that cased-hole flowmeters might not give an accurate picture of the flow intervals. Therefore, only openhole flowmeters were used, and in the case where a well had multiple open-hole flowmeters, an FFI was calculated for each flowmeter for every one foot interval. The flowmeter with the highest FFI at any interval was then selected for that well and was used to map the FFI.
To better understand the contribution of oil and water, an FFI was calculated for both oil and total flow. The absolute values for the FFI oil ranged from 0 to 59 and for FFI total from 0 to 89. Therefore, as an example, if the value of the FFI was 32, then this implied that 32 per cent of the oil or total flow contribution was from that one foot interval.
Using the highest value for each FFI, the data was normalised to unity. An FFI near 1.0 represented high flow, and an FFI of 0 represented no flow contribution.
It was noticed that some wells may have a similar flowmeter. However, the well's rate was significantly different.
To account for the rate, the FFI oil was multiplied by the oil rate and the FFI total was multiplied by the total flow rate. Again, this data was normalised to unity using the highest calculated value.
Therefore the four FFIs are:
FFI oil = % of oil flow per one foot interval
FFI total = % of total flow per one foot interval
FFI oil rate = (FFI oil) x (oil rate)
FFI total rate = (FFI total) x (total fluid rate)
These were then normalised to unity using the maximum value for that index.
FFI mapping
The result of this work was the development of four FFIs, which quantitatively defined high flow at every one-foot interval for every well in the 'Uthmaniyah area. The next step in this process was to map the data. The main intent of mapping was to understand the horizontal and vertical distribution of the high-flow intervals.
It was important to correlate the FFI data from well to well to determine the 'Uthmaniyah areas that exhibit high flow and to understand its affect on reservoir performance.
Figure 1 shows a map of geobodies for FFI total for Zone 2A.
Note the distribution is based on a GOCAD proprietary interpolation scheme; however, several other interpolation schemes were investigated.
It is important to note that in areas where the data was sparse, the interpolation scheme was allowed to estimate values.
These values need to be viewed with an understanding of their origin.
Once mapping of the FFI data was complete, other geological and reservoir data could be added.
A preliminary dolomite per cent was calculated from RDD data. This was placed on top of the FFI data to determine if a correlation could be derived.
This data could be viewed at every one-foot interval for the entire 'Uthmaniyah Arab-D reservoir.
Further investigation of correlating FFI data necessitated the integration of many types of data. This includes both geological, reservoir and well data, some of which are listed below:
All of this data was loaded into GOCAD, which allowed the data to be displayed or cross-plotted in any way desired.
This was a major breakthrough in that several types of data could be viewed simultaneously to understand their effect on reservoir performance.
Figure 2 shows a preliminary dolomite distribution, along with the actual log used to help calculate the distribution.
Figure 3 shows how several different types of data can be displayed simultaneously. Note that this display shows geophysical, geological and observed reservoir performance data. To date there has been no source of data that could not be mapped and displayed using GOCAD.
As an example of how this data can help explain reservoir performance, Figure 4 shows an example of the top of GOSP-9 area.
Note that wells in this area are some of the most prolific producers in 'Uthmaniyah. The evidence of high KH values supports this, which is shown in colour contours, with the colour white being the maximum value. Also the PI data, shown in line contours, indicates high values in this area.
Another example of how several types of data can be combined and viewed to analyse a particular area is shown in Figure 5.
This figure shows the top of Zone 2A, and combines a fault interpretation map, colour contours of dolomite per cent and 1,997 flood front and line contours of FFI total.
Although this represents only the data as depicted in the first one-foot interval of the top of Zone 2A, it does point out that this area has faults and a high percentage of dolomite, which can be associated with probable super-K events.
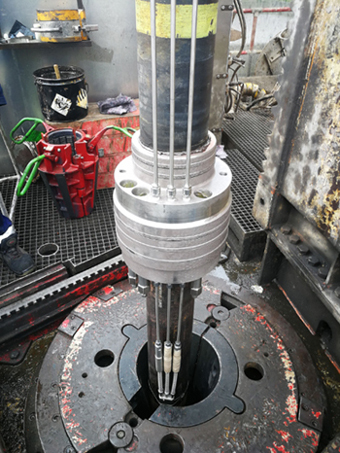
Another important feature of using GOCAD to view data is the ability to look at multiple cross-sections simultaneously.
Well logs can also be displayed alongside a given cross-section to investigate the vertical and horizontal distribution of data.
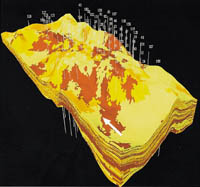
Another example of using GOCAD to view data to identify trends, or lack thereof, is shown in Figure 6. This figure shows multiple cross-sections of per cent dolomite, along with a flowmeter profile for UTMN0071. The blue colour indicates that the amount of dolomite is more than 70 per cent.
The wide portion of the flowmeter represents the upper part of Zone 2A and is showing a high per cent of dolomite.
It is also interesting to point out that the dolomite tends to streak and does not show any observed continuity in either the East-West or North-South direction.
The next step
There is a certain amount of hype surrounding the ''common earth model'' idea. However, this does not take away the accomplishments that are beginning to be made implementing this general idea.
One figure results in seismic ''time'' domain data incorporated in the ''depth'' domain with geological fault and fracture plane interpretation and engineering data. In the final analysis, this may not be sufficient, but it does demonstrate a starting point not easily achieved in earlier geoscience workflows.
Once in this domain, incorporating additional data as understanding of the reservoir changes or to meet different objectives for the different disciplines becomes a much simpler matter.
Figure 7, in particular, shows seismic impedance data modelled with field production data in the context of the best geological facies interpretation available.
Forward modelling in the generic sense is possible where geoscientists can look to see if seismic impedance shows any relationship to field production logs and not the reverse, where, if a theory doesn't exist, the possibility is not investigated.
In the common earth model, investigating becomes easier. In addition, data that has been modelled in a common earth model may lead to novel ways of using data in a multidisciplinary mode.
This would be based on a properly built and QC'd model, where each discipline is satisfied that their data has been properly handled.
The data types required for the common earth model begin with geographic (GIS) information, surface and near-surface data, seismic data, whether they be the final stack trace or result from prestack analysis or the seismic models required to do the analysis, VSP data, log data from the surface, subsurface geological and geophysical interpretation, production data and a risk assessment of each of the data types.
In the common earth model, each data type can contribute to the full picture of the reservoir interval, and as technology improves the transition between models can be made smoothly.
This article appears courtesy of the Saudi Aramco Journal of Technology