


 Oman’s quarterly oil output rises only slightly
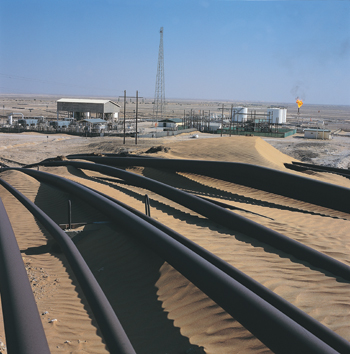
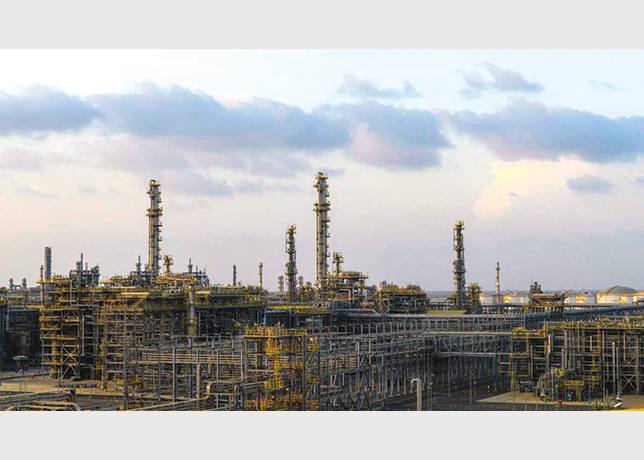
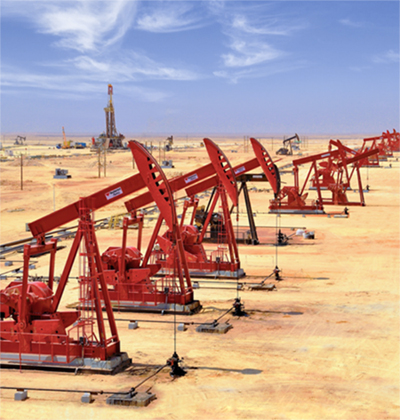
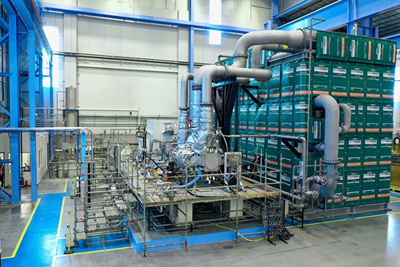
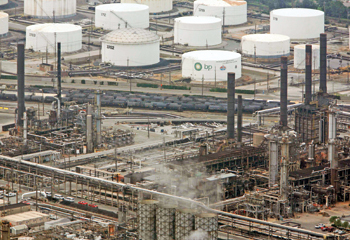
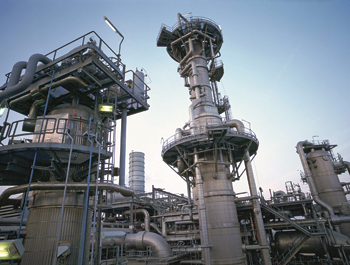
OIL production in Oman witnessed an increase during the first quarter Q1 of 2014 resulting in the growth rate of one per cent; however oil prices per barrel and total oil exports declined during the same period. Additionally, natural gas production including imports and local production declined during Q1 of 2014, when compared with the same period in 2013.
Breaking down the figures, oil production during the first quarter of 2014 rose to 85.3 million barrels compared with 84.5 million barrels during the same period in 2013, reflecting an increase of one per cent.
The overall rate of growth is attributed to the increase in crude oil production by 3.5 per cent, recording 77.6 million barrels in Q1 2014, compared with 74.9 million barrels during the first quarter of 2013. In addition, condensate production rose to 7.7 million barrels for Q1 of March 2014, compared with 9.5 million barrels during the same period in 2013, reflecting an increase of 18.3 per cent.
A quarterly report on crude oil and gas production issued by the National Centre for Statistics and Information (NCSI) reveals a one per cent increase in daily average crude oil production during Q1 of 2014, recording 948,400 barrels per day compared with 938,900 barrels per day during the same period in 2013.
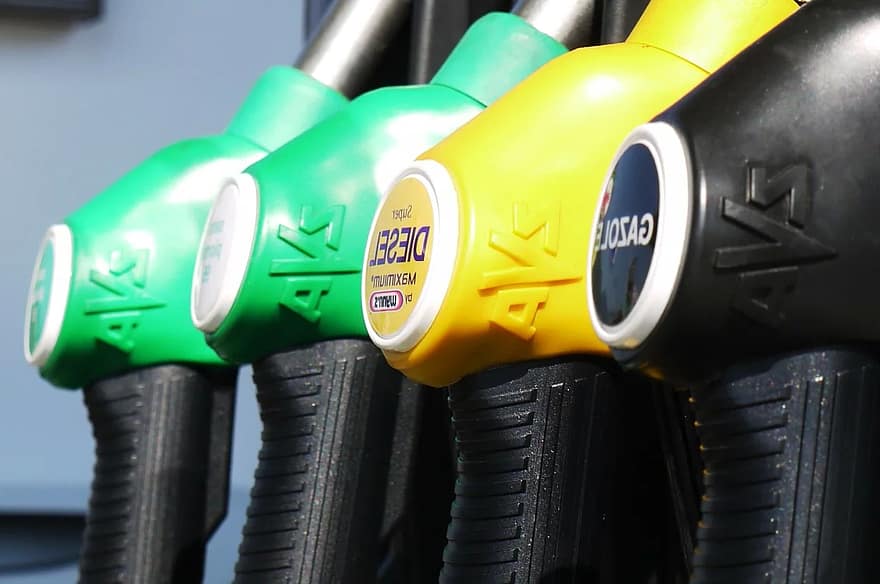
On the other hand, the average oil price per barrel declined to $105.96/ bbl when compared with $107.03/bbl during the same period in 2013, representing a decrease of one per cent. The report also reveals a decline in the total volume of oil exports by 4.9 per cent, registering 71.2 million barrels during Q1 of 2014, compared with 74.8 million barrels exported during the same period in 2013.
Regarding exports of crude oil during the first quarter of 2014, China topped the list of the countries importing crude oil from Oman with 49.9 million barrels exported to China compared with 42 million barrels during the same period in 2013, representing an increase of 18.7 per cent.
In second place was Taiwan which imported 8.79 million barrels in Q1 2014, compared with 8.08 million barrels imported during the same period in 2013, reflecting an increase of 8.9 per cent. Following was Japan which imported 4.897 million barrels during Q1 of 2014 compared with 8.427 million barrels in the same period in 2014 which is a decline of 41.9 per cent.
Meanwhile, natural gas production, which include imports and local production declined by 7.6 per cent in Q1, recording 8,991 million cubic metres, compared with 9,732 million cubic metres during the same period in 2013. The fall is a result of the reduced production of non-associated gas by 9.1 per cent, recording 7,320 million cubic metres during Q1 of 2014, compared with 8,052 million cubic metres during the same period in 2013. Associated gas also declined by 0.5 per cent, recording 1,672 million cubic metres during the first quarter of 2014, compared with 1,679 million cubic metres during the same period in 2013.
The uses of natural gas during Q1 of 2014 was distributed among power generation, industrial areas (includes Gas Consumption in Industrial Estates, Oman Mining Co., Oman Cement and S.Q.U) and industries projects. The consumption of natural gas in power generations increased by 7.3 per cent to 1,557 million cubic metres when compared with 1,451 million cubic metres during the same period in 2013. In addition, industries areas consumption decreased to 150 million cubic metres by the end of March 2014 when compared with 186 million cubic metres during the same period in 2013, representing a decline of 19.4 per cent. The consumption in industries projects also declined by 4.2 per cent to 5,556 million cubic metres during Q1 of 2014, compared with 5,801 million cubic metres during the same period of 2013.
Natural gas use in oil fields by the end of the first quarter of 2014 stood at 1,728 million cubic metres, compared with 2,294 million cubic metres registered during the same period in 2013, a decline of 24.7 per cent. The uses were distributed among fuel, re-injection, flared, and others including (loss, metres discrepancies, deflation factor).
Consumption in fuel declined by 11.4 per cent to 504 million cubic metres compared with 569 million cubic metres consumed during the same period in 2013. Re-injection consumption declined to 574 million cubic metre, representing a decrease of 19.8 per cent compared with the same period in 2013.
Uses in “flared” recorded an increase of 4.8 per cent to 372 million cubic metres, when compared with 355 million cubic metre during the same period in 2013. Consumption with “others” declined by 57.6 per cent to 277 million cubic metres, compared with 654 million cubic metre during Q1 of 2013.